Materials
- An ESP32 devkit - (they're only ~$15 online - I picked mine up from Vetco)
- A Nova PM SDS011 air sensor - you can get these for $20-25 online
- A Raspberry Pi or any device capable of running a simple Bun HTTP server
- Some DuPont cables
Why an ESP32
These devices are cheap & portable and can be programmed using the Arduino IDE. There's also libraries for the SDS011 already available - I use this one.
It is possible to connect the SDS011 directly to the Pi. However, I intend for this monitor to be portable. The Raspberry Pi will be the stationary server that the ESP32 communicates with to store its data.
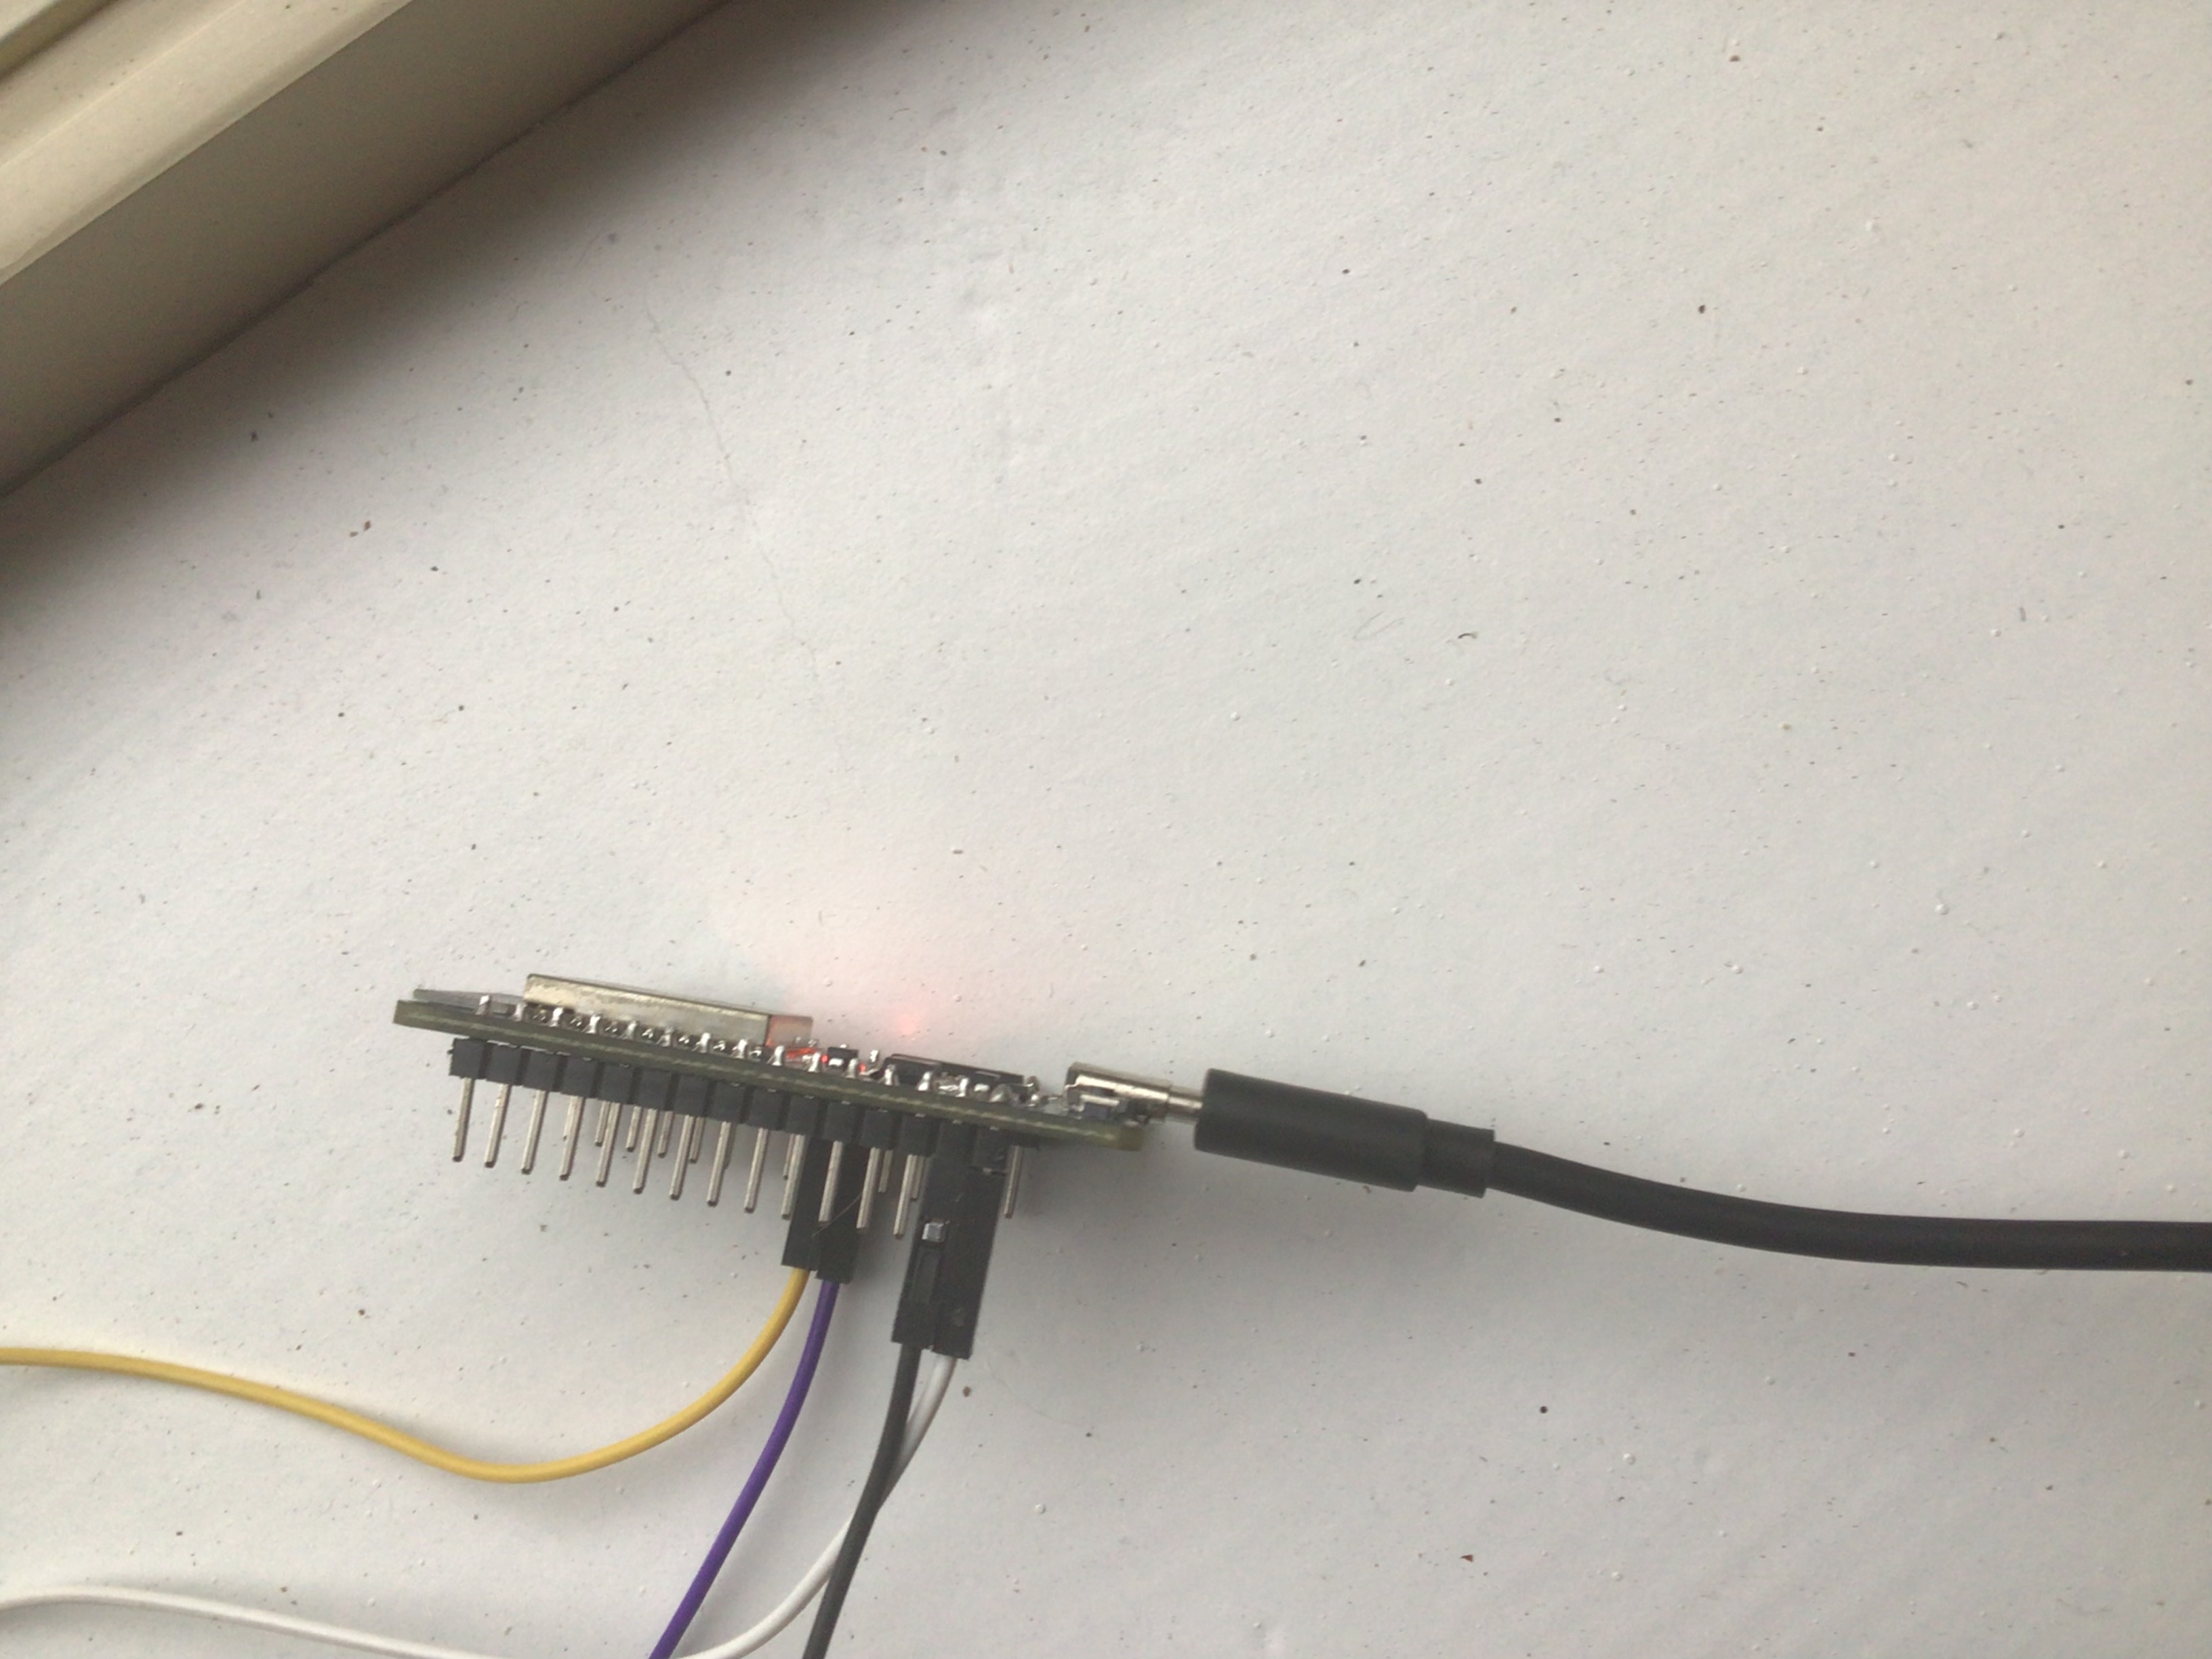
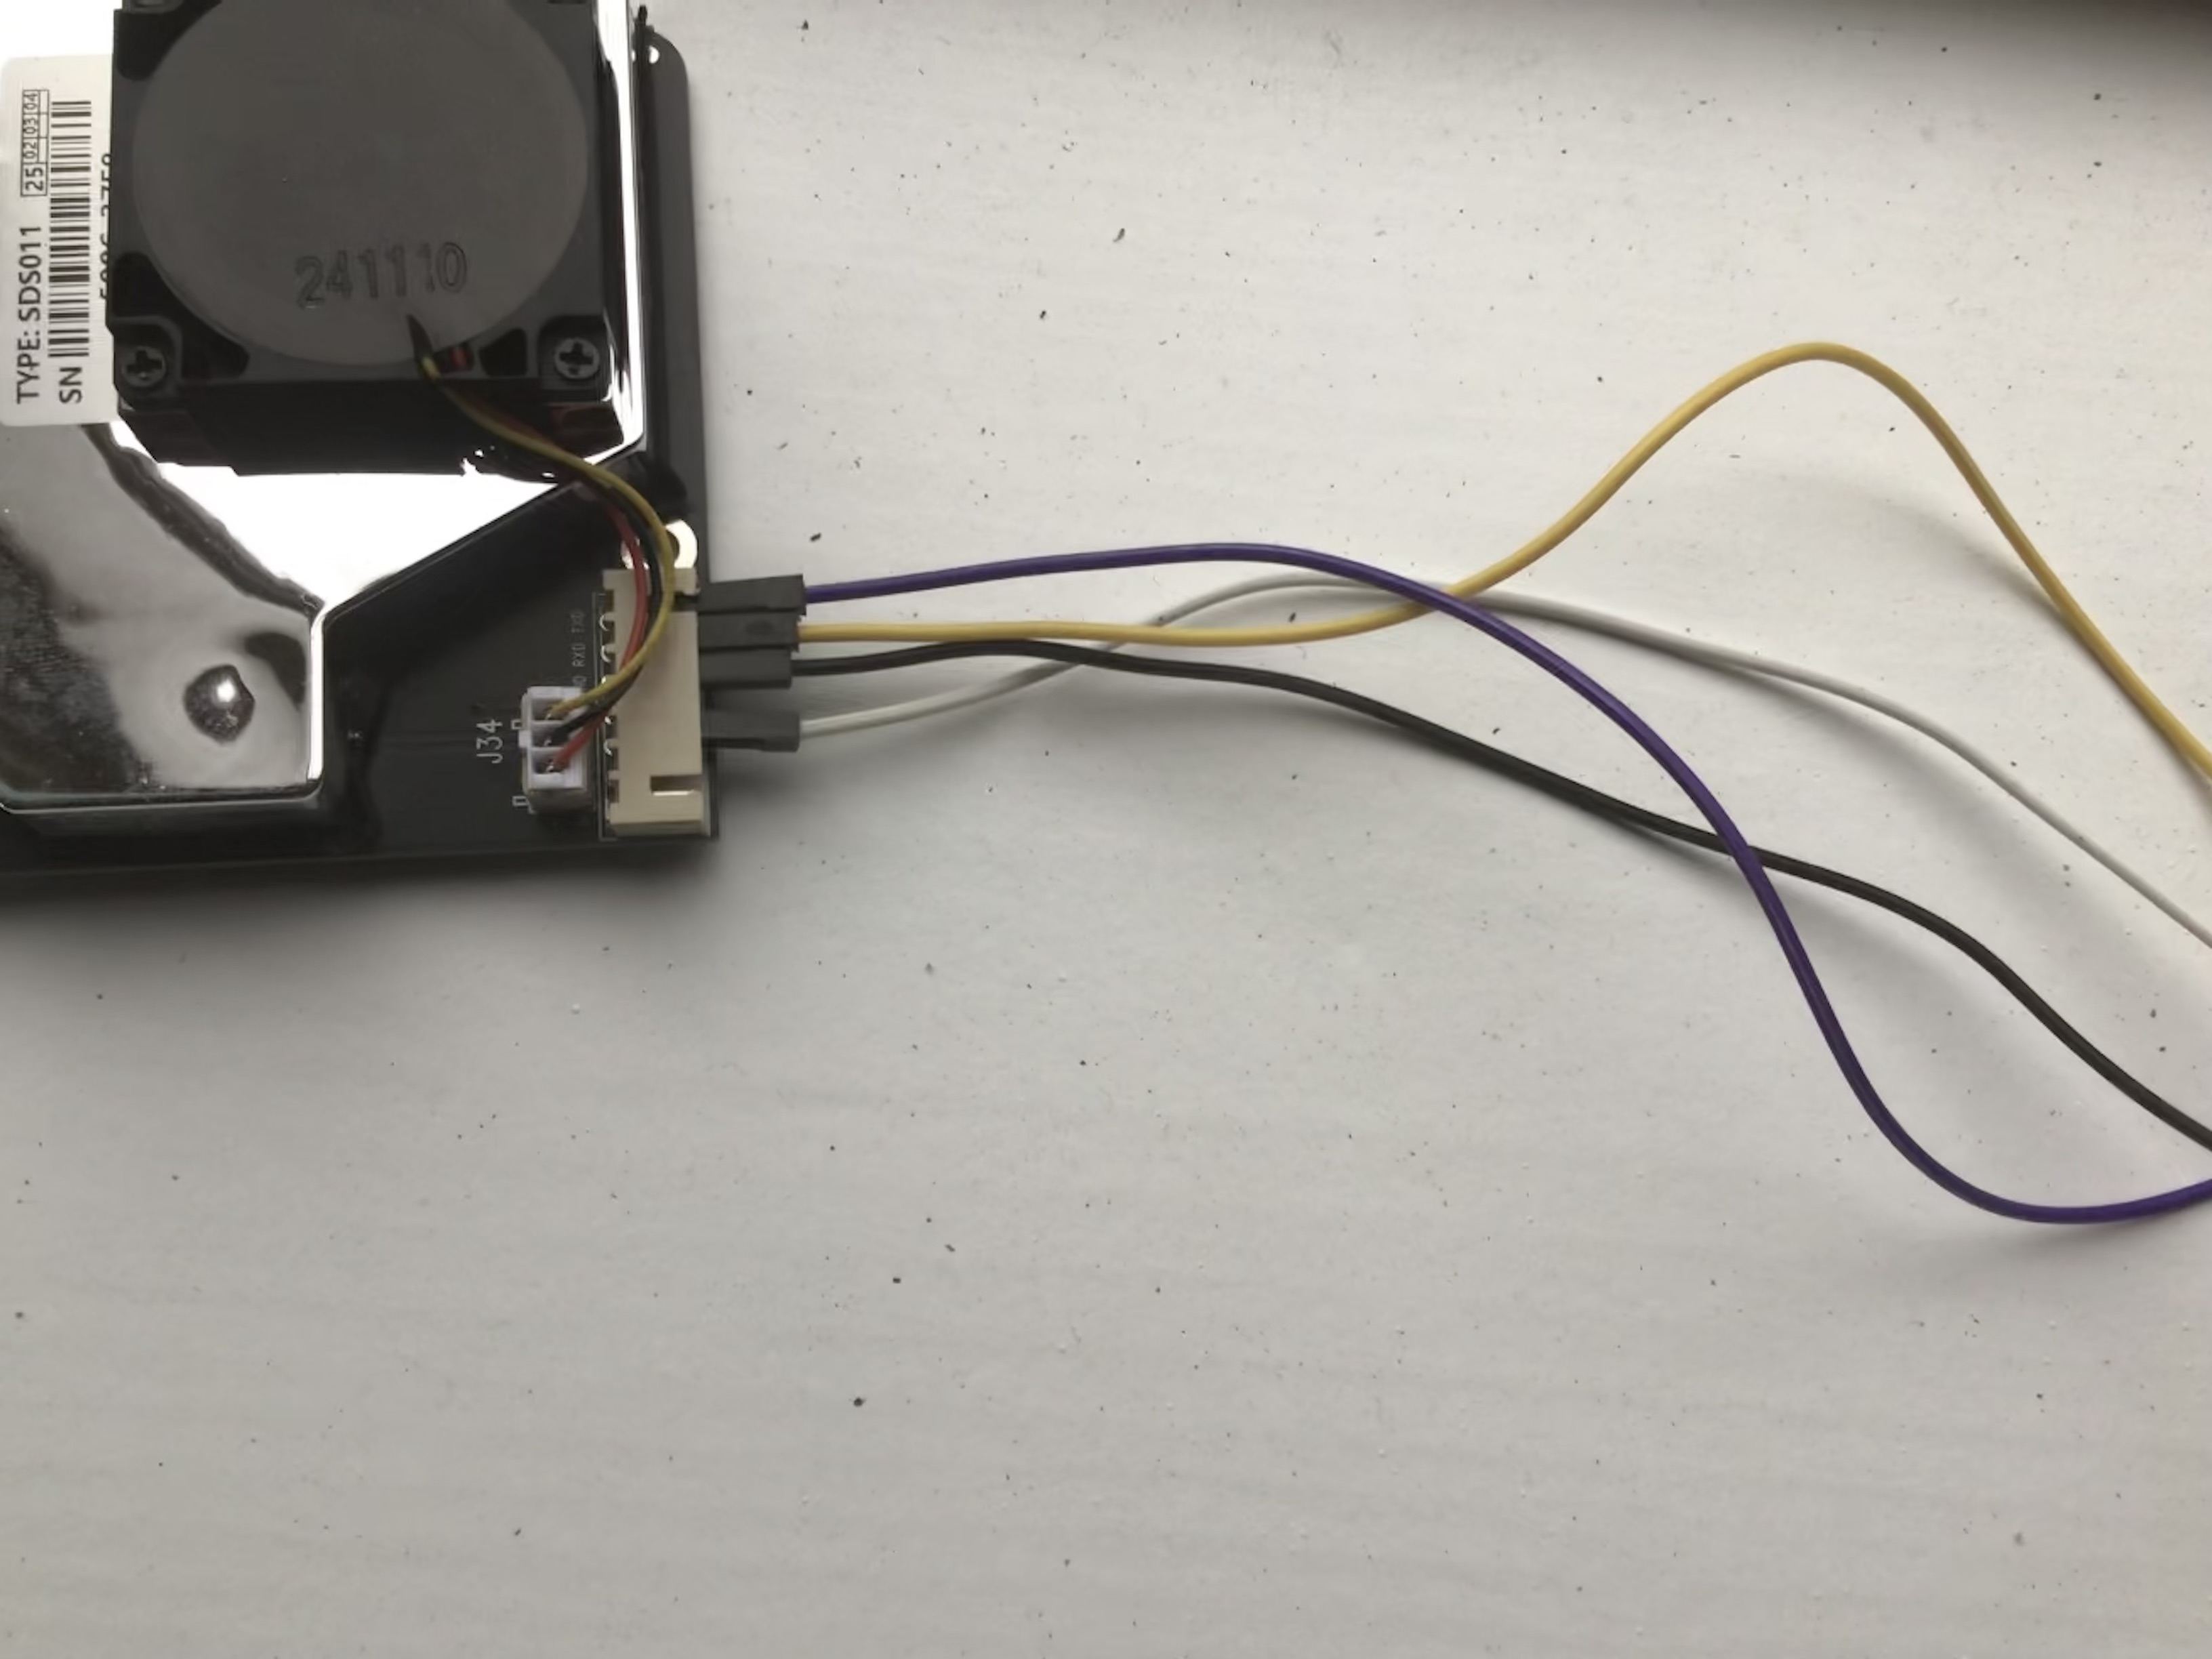
To connect it to the SDS011, connect four DuPont cables in this configuration:
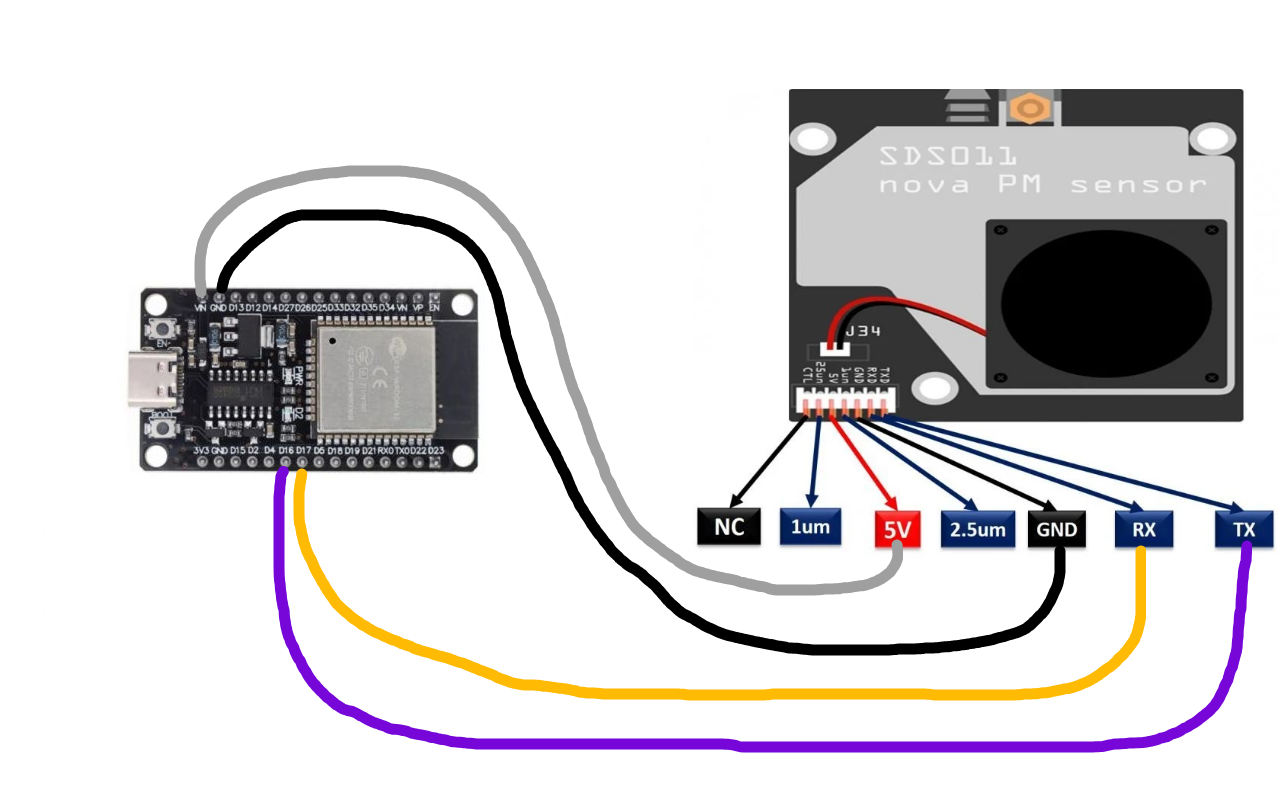
My very well put-together cable diagram
ESP32 + Arduino
I've made the code available as a Gist here. Simply copy the code into a new sketch in the Arduino IDE, update your network credentials & server hostname and upload it to your ESP32.
The code simply connects to the network and reads & sends the SDS011 readings to a configured hostname every 10 minutes.
Sending data to the Pi
The Raspberry Pi is powerful enough to handle large databases & run a LAN HTTP server. For this, I've chosen to use NixOS and configure my system entirely declaratively. The code for the Bun webserver & database manager is available on my Homelab repo.
The webserver handles both GET and POST.
POST requests are rate limited to allow a new entry once per 9 minutes. The raw PM2.5 & PM10 data from the ESP32 and its timestamp is saved on an SQLite database stored on the attached USB drive.
In my homelab repo, you'll also find a completely reproducible NixOS flake to build my exact configuration. More information is available in my Homelab journal entry.
Graphing the data
The Pi keeps all received data in a database, stored in an attached USB drive. We can query this database to get all entries & organize them in a graph.
Root GET requests will simply return a styled webpage which displays this data in a human-friendly page. However, there are two routes which can get the database historical data for the past 24 hours or past 7 days.
On the homepage, you'll see a toggle between 7-day or 24-hour data periods, which just changes the query route.
Using the PM2.5 & PM10 data, we can calculate the AQI. Since AQI values fall within a group, we can also show a one-word air quality summary. UPlot handles the timestamp stuff for us and makes a great-looking time series graph. The webpage code is available here.
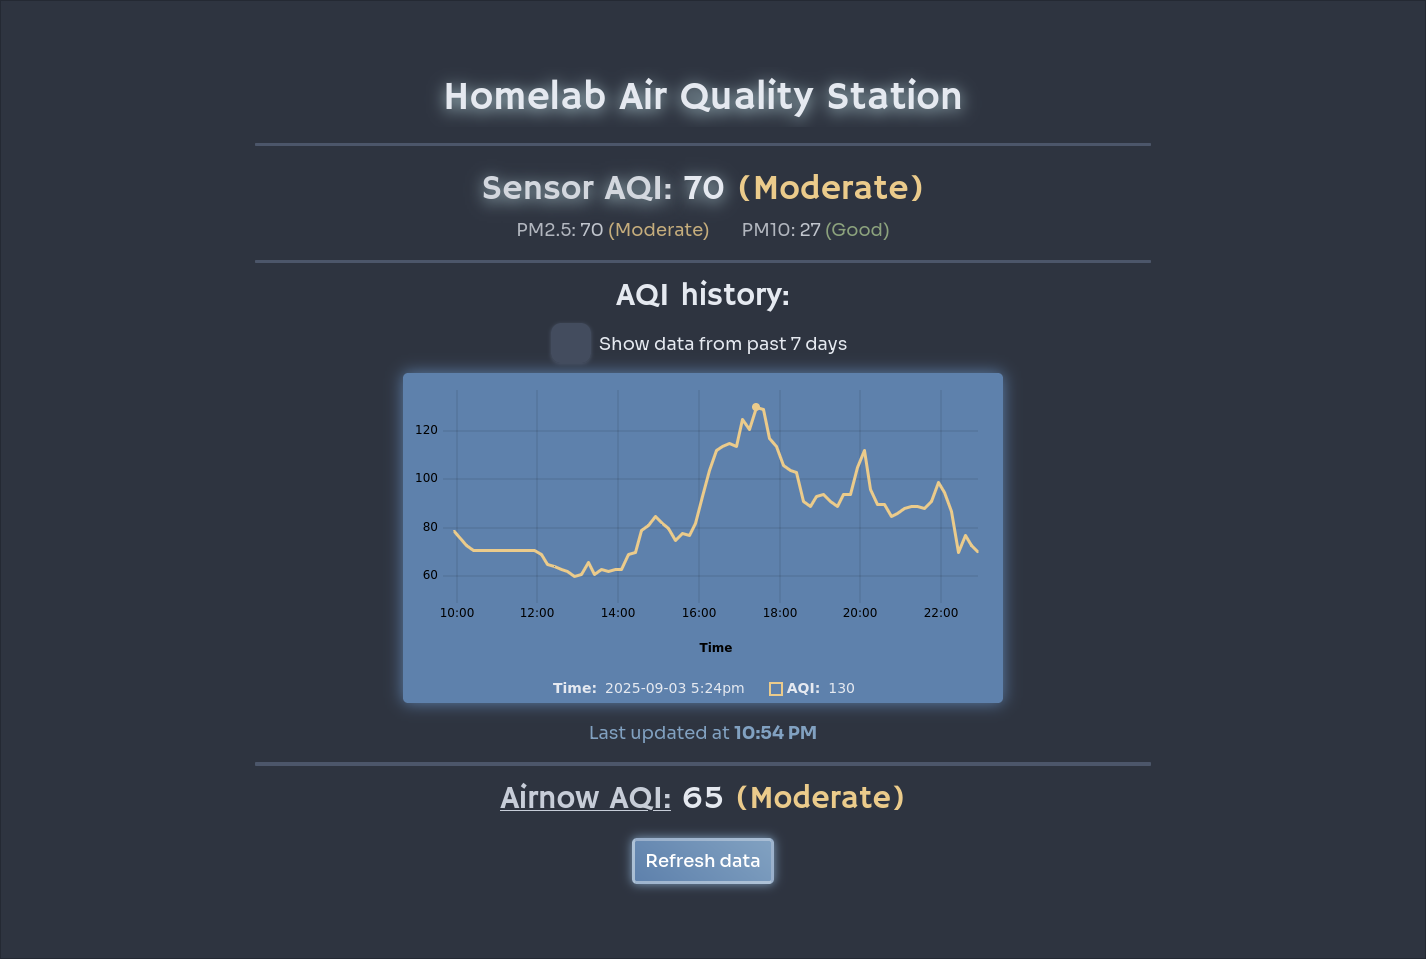
Data being collected at the beginning of our smoke season
Source code & resources
The ESP32 sketch is available in this gist. Raspberry Pi code (webserver, drive management, etc.) and a reproducible system flake is available in my Homelab repo.